Analytics overview
Read your project's revenue, subscribers and activity in Studio, and learn the rules every report follows.
Studio's analytics combine the purchases Voidhash checks with the stores and the events your apps and websites send, so revenue, subscriptions and behavior come from one place. Start on the Overview page, then open a report under Analytics for detail.
The Overview page
Overview, at the top of the Studio sidebar, is a project's home dashboard.
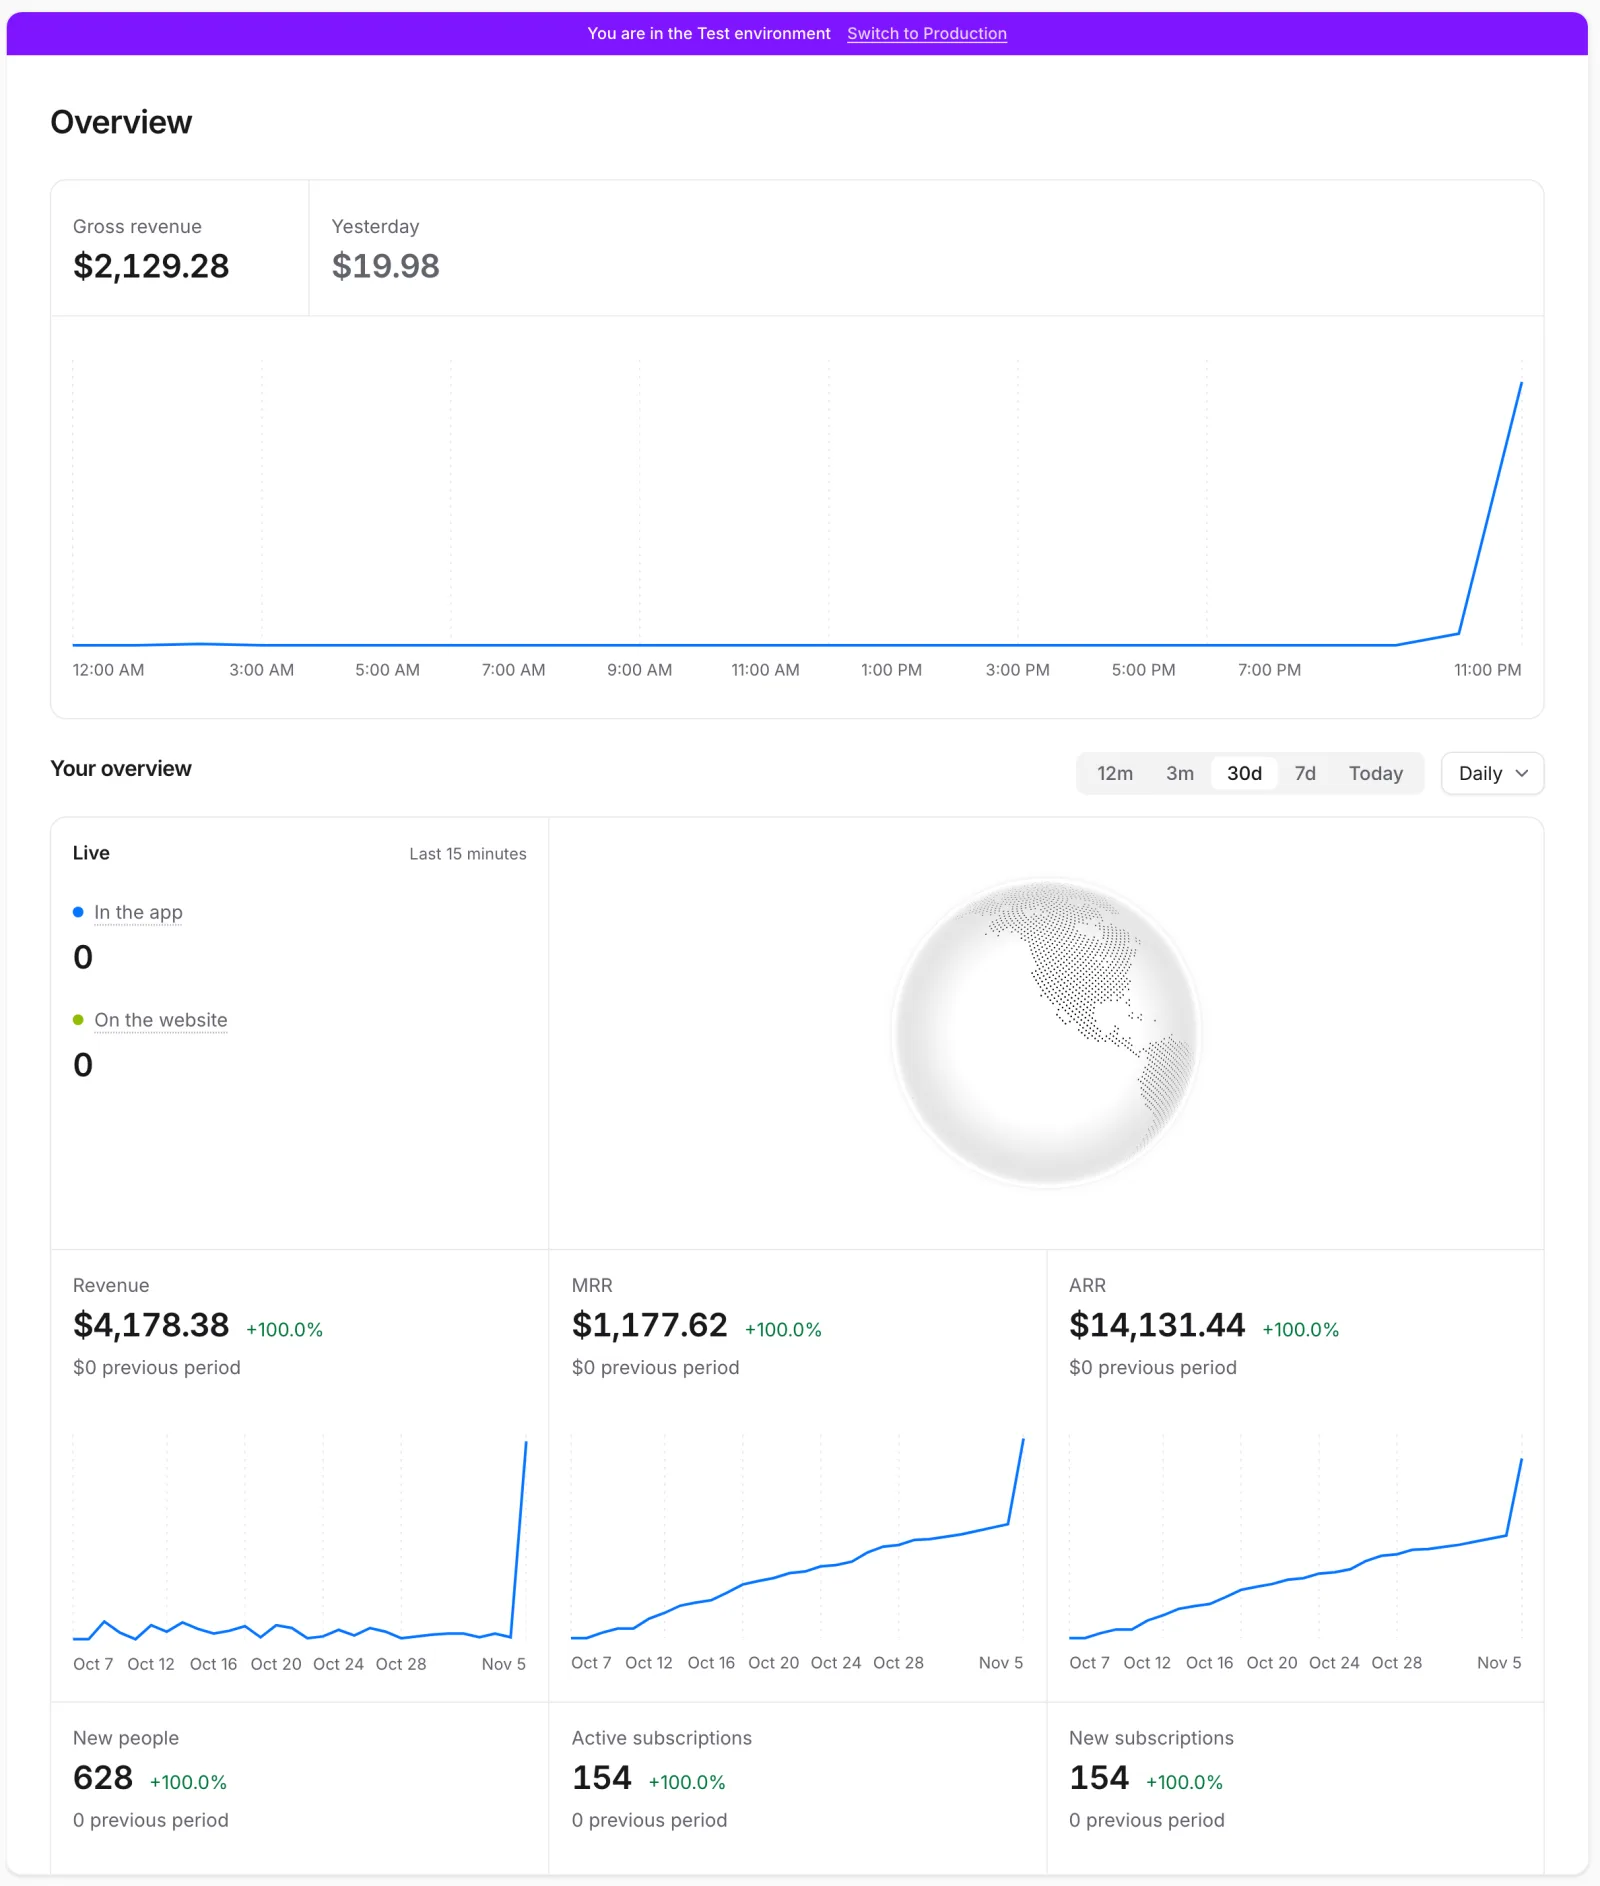 Overview shows today's revenue and who's active now
- A message box addressed to Void, if your team has bots. What you write opens your conversation with Void, already sent.
- Revenue today and Yesterday: revenue so far today, by hour, next to yesterday's total. Point at an hour today has reached to see what yesterday had made by then.
- Six cards, each over its own fixed span, by day: Revenue, Monthly recurring revenue and Active subscriptions over the Last 30 days, Trials started and New subscriptions over the Last 7 days, and Churned subscriptions over the Last 30 days. Each shows one number for its span (see Headline numbers), a small chart and a comparison: the value 30 days ago for monthly recurring revenue and active subscriptions, and the span before of the same length for the rest. A rise in churned subscriptions shows as bad news.
- A globe of who's online now: people active in the last 15 minutes in your apps and on your websites, counted together, so someone in both counts twice. Locations are rounded to whole degrees, so the globe shows regions, not addresses. It refreshes every minute.
The Overview page has no range or filter controls: for other spans, granularity, filters and every other metric, open the Analytics pages.
To see today's revenue and the metric cards for all projects together, open the project switcher and choose Team overview.
Each metric is defined in Metric definitions.
Where to find each report
| Page | Answers |
|---|---|
| Analytics → Revenue, Subscribers, Trials, Churn | How much you earn, from whom, and why it changes. |
| Analytics → Audience, Web, App, Locations | Who uses your product, how often, and where. |
| Analytics → Paywalls, Push | How paywalls convert and what push notifications bring back. |
| Analytics → Acquisition, and the Ads pages | Where people come from and what your ads return. |
| Analytics → Data health | Whether your data arrives complete and on time. |
| Analytics → Alerts | What to tell your team when something breaks. |
| Analytics → Insights, Dashboards, Query | Your own charts and queries (Voidhash Cloud). |
| Activity → Analytics events | The latest raw events, one by one. |
See Reports for what each page shows.
Reporting currency
Revenue, MRR and ad reports of every project in a team show money in one currency. Choose it under Settings → Team → General → Reporting currency. Until you choose one, revenue shows in US dollars, and ad reports in their ad accounts' currency, or US dollars when the accounts differ.
Payments keep the currency they were charged in, so you can change the reporting currency at any time and past numbers convert again.
- Revenue converts at the exchange rate of the UTC day it was paid. A payment charged in the reporting currency shows as charged.
- MRR converts at the rate at the end of each period, so a subscription's MRR doesn't drift with the rates of its past renewals.
- Rates update daily. A day without a rate uses the latest rate from the 7 days before it.
- A/B test results and queries stay in US dollars.
Admins and the owner can change the currency.
Environments
Analytics shows one environment at a time: Production, Sandbox or Test, chosen in the project switcher. Outside Production, a colored bar says which one you're in.
Revenue and subscriptions count the purchases of the selected environment. Production and Sandbox show activity from your released apps and website; Test shows activity from your developers' test setups. People aren't split by environment.
Time zones
Studio uses your browser's time zone. Days, weeks and months start at midnight there, weeks start on Monday, and a day when clocks change lasts 23 or 25 hours. A teammate in another time zone sees the same events split into different days. Alerts always work in UTC.
Data freshness
Reports read your data when you open them, with no overnight batch:
- An event counts about a minute after it reaches Voidhash.
- A subscription that lapses without a store notification leaves MRR after 1 day.
- Lifetime value per payer and other per-person totals refresh every 10 minutes.
- Ad spend syncs every hour. See Connect Meta Ads.
Events from devices that were offline arrive late and fill in the last day, so yesterday's numbers can still grow a little. The Data health page shows how late events arrive.
If something's off
- Everything is zero: check the environment in the project switcher. Test data only shows under Test.
- Numbers differ from App Store Connect: see the FAQ.
- A chart is empty: see Why a chart is empty.
Next steps
Still stuck? Check Troubleshooting, ask us on Discord, or email support@voidhash.com on a paid plan.
Something wrong or missing on this page? Tell us by email or on Discord.